Generalization
Generalization refers to your model's ability to adapt properly to new, previously unseen data, drawn from the same distribution as the one used to create the model.
Overfitting
Overfitting means creating a model that matches (memorizes) the training set so closely that the model fails to make correct predictions on new data. An overfit model is analogous to an invention that performs well in the lab but is worthless in the real world.
In Figure 11, imagine that each geometric shape represents a tree's position in a square forest. The blue diamonds mark the locations of healthy trees, while the orange circles mark the locations of sick trees.
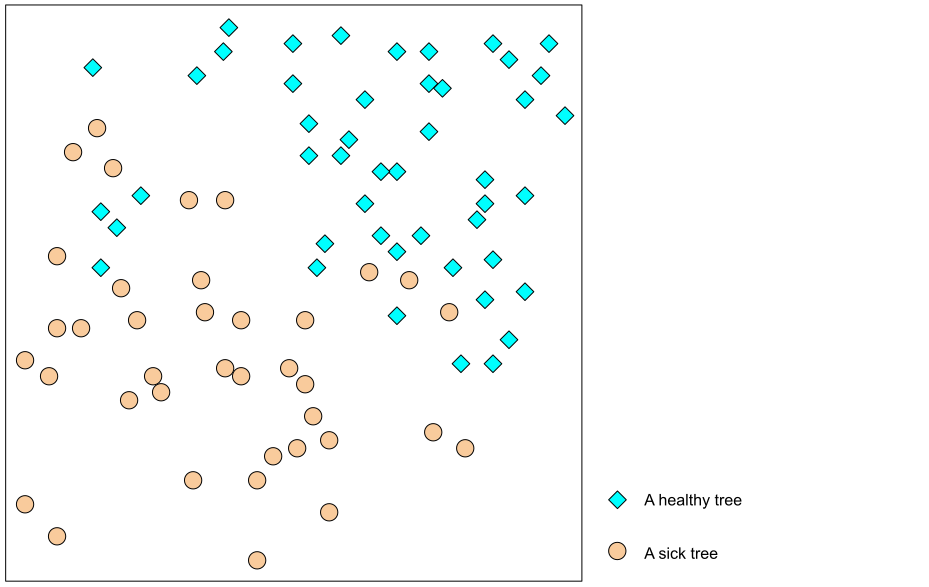
Figure 11. Training set: locations of healthy and sick trees in a square forest.
Mentally draw any shapes—lines, curves, ovals...anything—to separate the healthy trees from the sick trees. Then, expand the next line to examine one possible separation.
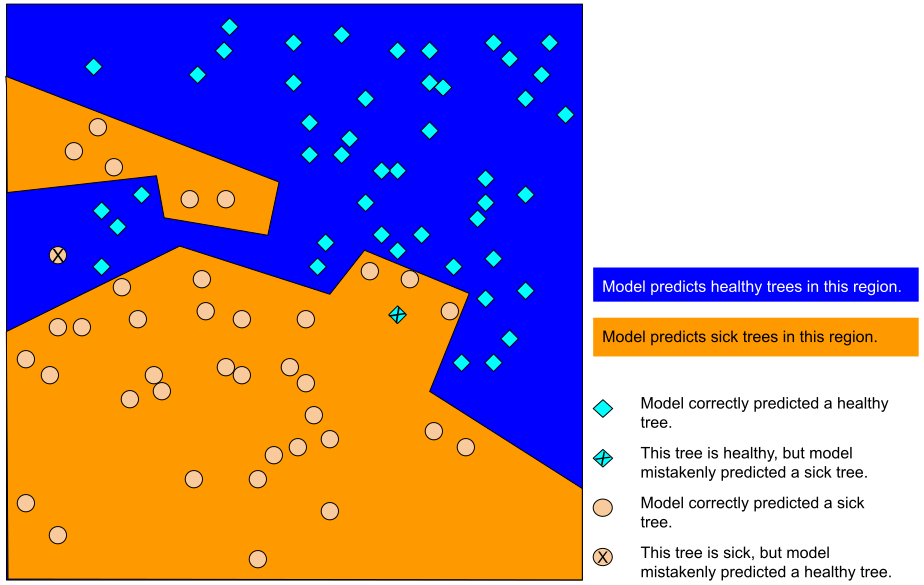
Figure 12. A complex model for distinguishing sick from healthy trees.
The complex shapes shown in Figure 12 successfully categorized all but two of the trees. If we think of the shapes as a model, then this is a fantastic model.
Or is it? A truly excellent model successfully categorizes new examples. Figure 13 shows what happens when that same model makes predictions on new examples from the test set:
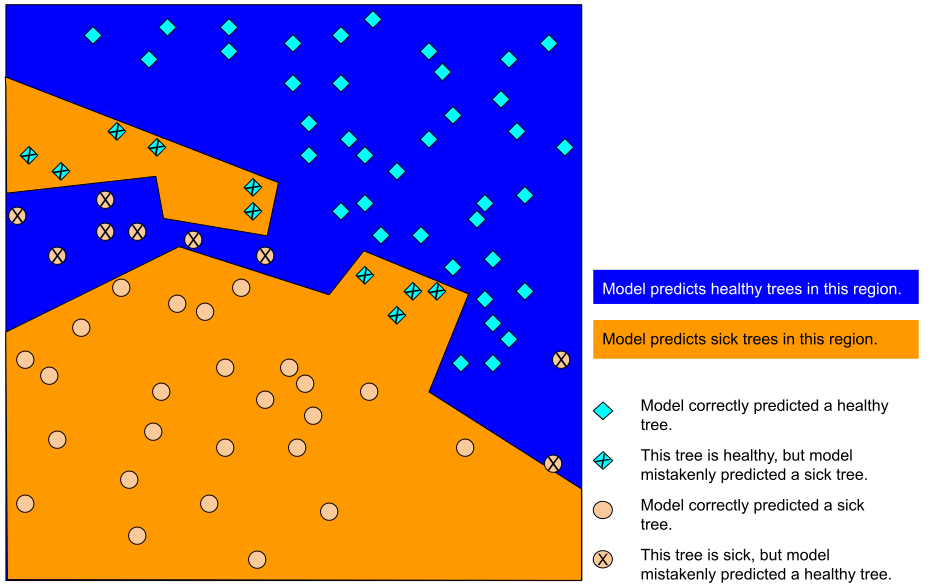
Figure 13. Test set: a complex model for distinguishing sick from healthy trees.
So, the complex model shown in Figure 12 did a great job on the training set but a pretty bad job on the test set. This is a classic case of a model overfitting to the training set data.
Fitting, overfitting, and underfitting
A model must make good predictions on new data. That is, you're aiming to create a model that "fits" new data.
As you've seen, an overfit model makes excellent predictions on the training set but poor predictions on new data. An underfit model doesn't even make good predictions on the training data. If an overfit model is like a product that performs well in the lab but poorly in the real world, then an underfit model is like a product that doesn't even do well in the lab.
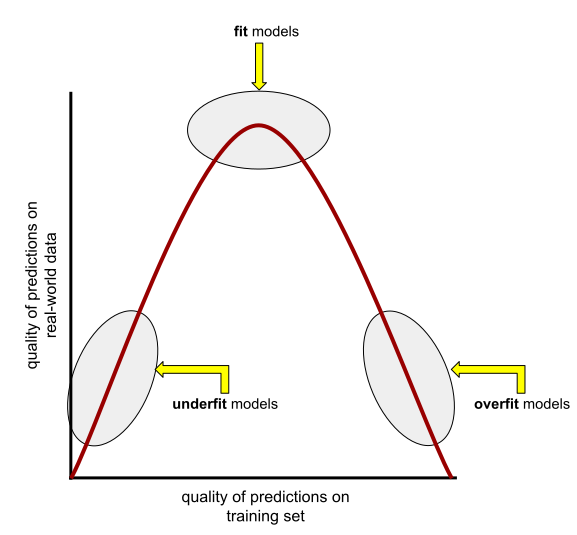
Figure 14. Underfit, fit, and overfit models.
Generalization is the opposite of overfitting. That is, a model that generalizes well makes good predictions on new data. Your goal is to create a model that generalizes well to new data.
Detecting overfitting
The following curves help you detect overfitting:
- loss curves
- generalization curves
A loss curve plots a model's loss against the number of training iterations. A graph that shows two or more loss curves is called a generalization curve. The following generalization curve shows two loss curves:
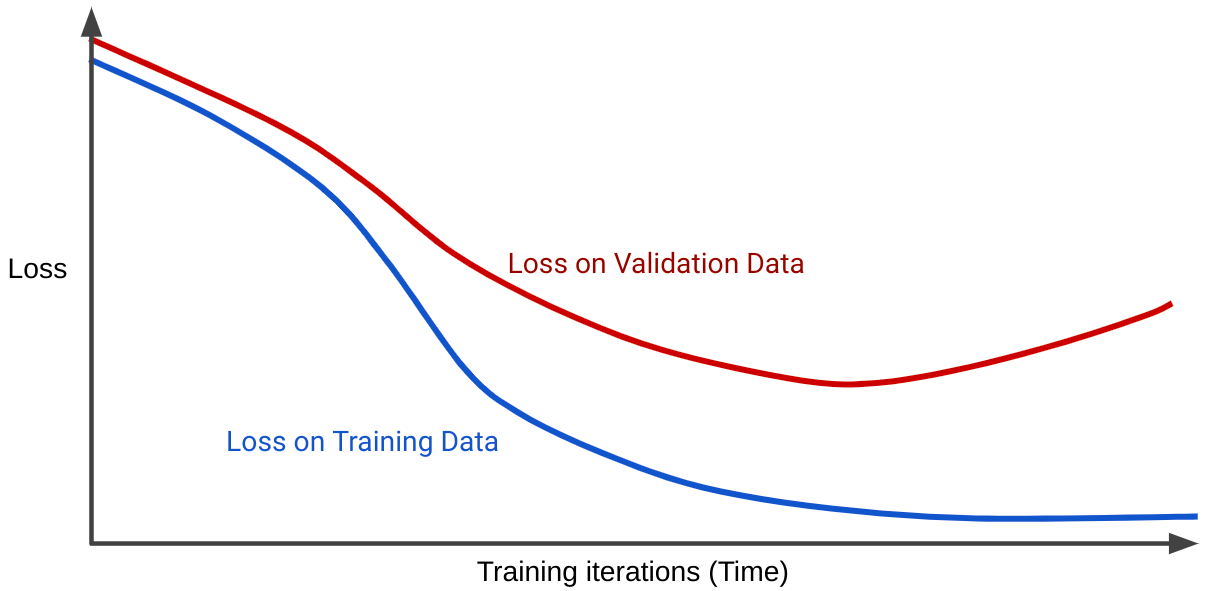
Figure 15. A generalization curve that strongly implies overfitting.
Notice that the two loss curves behave similarly at first and then diverge. That is, after a certain number of iterations, loss declines or holds steady (converges) for the training set, but increases for the validation set. This suggests overfitting.
In contrast, a generalization curve for a well-fit model shows two loss curves that have similar shapes.
What causes overfitting?
Very broadly speaking, overfitting is caused by one or both of the following problems:
- The training set doesn't adequately represent real life data (or the validation set or test set).
- The model is too complex.
Generalization conditions
A model trains on a training set, but the real test of a model's worth is how well it makes predictions on new examples, particularly on real-world data. While developing a model, your test set serves as a proxy for real-world data. Training a model that generalizes well implies the following dataset conditions:
- Examples must be independently and identically distributed, which is a fancy way of saying that your examples can't influence each other.
- The dataset is stationary, meaning the dataset doesn't change significantly over time.
- The dataset partitions have the same distribution. That is, the examples in the training set are statistically similar to the examples in the validation set, test set, and real-world data.